Azadea Project
Business Flow
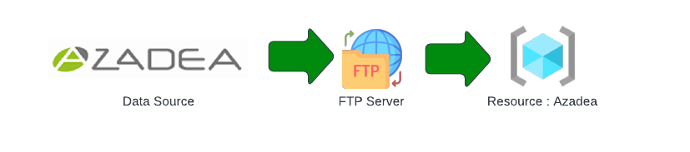
Step 1
The data for Azadea is fetched from the FTP server and dumped into the Azure Resource Group.
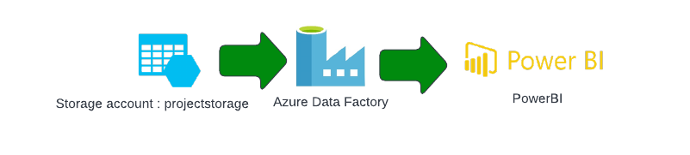
Step 2
The data from the Azadea Resouce group is stored in a storage account to create a pipeline in Azure Data Factory and connected with PowerBI to create a dashboard.
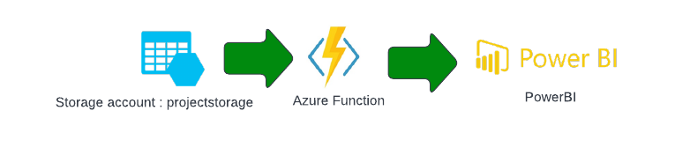
Step 3
Azadea Data in Project storage is finally passed through Azure Function to perform ETL (Extract, Transform and Load) to fetch CSV files and connect with PowerBI to create the visualization.
Technology Used
Azure Data Factory
The data for Azadea Report is fetched from the FTP server and is stored in the Blob Container with storage Account Azadea. The data from the storage account is then further used in the Azure Data Factory to create a pipeline flow to fetch the CSV files output for our dataset.

Azure Function
The Azure function connects the data source from the Blob Container with the storage account Azadea to transform our dataset through a code and each time the code is triggered the data for all the files is fetched in the CSV output format.
PowerBI
The data from the Azure Data Factory is connected with PowerBI by adding credentials to the Azure account and connecting the correct data source. PowerBI is used to create the dashboard for our analysis by creating the relationship model for the tables along with DAX expressions.
First View
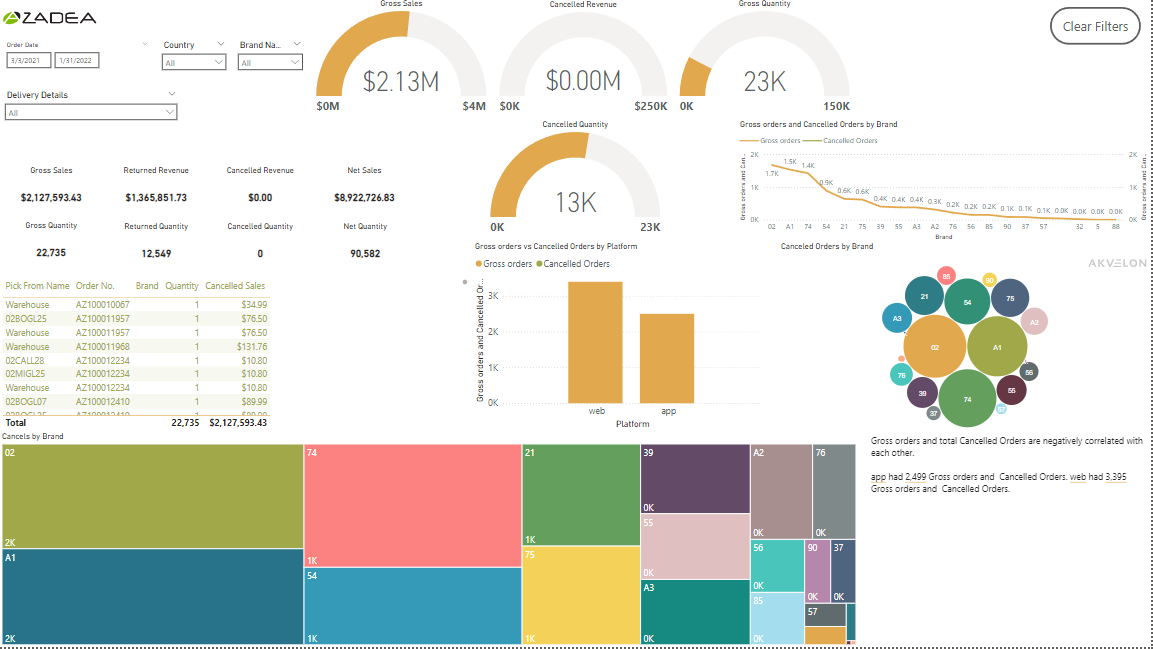

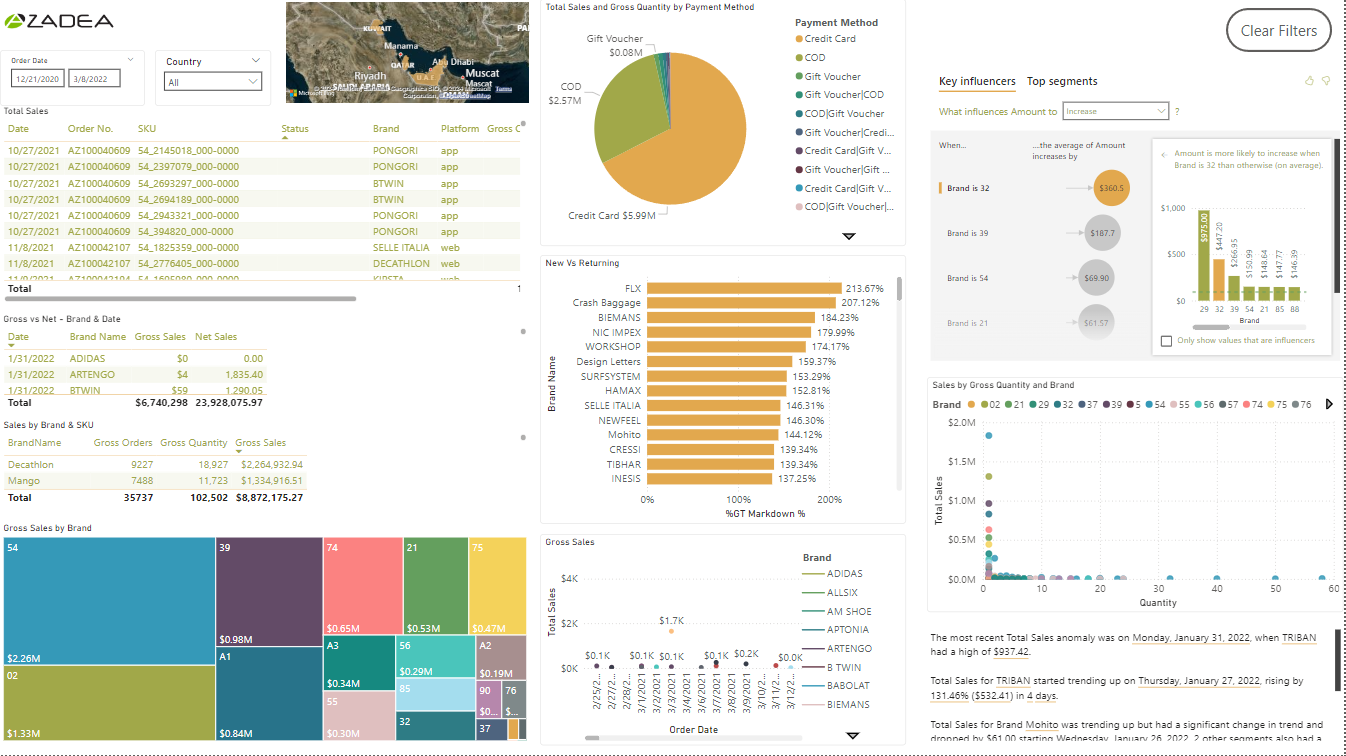
Summary
This project helps a user to understand which brand has generated the most orders in different regions. It tracks down the daily sales report that is purchased from either website or App along with the insight of those brands that are bought together in an order which will help in providing better satisfaction to the customers with their respective choice.